AI Agent Evaluation Metrics That Actually Matter
Focus on what completion rate actually measures to avoid shipping unreliable agents.

McKinsey's 2025 data puts 62% of organizations experimenting with AI agents, and 23% actively scaling them. That sounds like momentum; but fewer than 15% of the enterprises running agent pilots have reached true production scale.
So what's in that gap? It's not an engineering problem; it's a trust problem.
Teams can build agents. They just can't bring themselves to ship them. And if you've spent any time inside one of these pilots, you know exactly why. The demo works; the production environment is a different animal entirely — like a dress rehearsal that goes perfectly, only for the lead actor to forget every line on opening night.
Gartner predicts over 40% of agentic AI projects will be canceled by 2027. Not because the agents failed in the demo; because teams couldn't build the evaluation scaffolding to know whether they were doing the job reliably, safely, and economically once real users showed up.
A 2025 multi-university study looked at 30 production agent systems and found that most developers share very little about their safety evaluations and quality assessment practices. That's a transparency gap as much as a technical one. Brookings Institution convened over 40 experts on this problem and landed on a framing that stuck with me: "We cannot govern what we cannot measure."
That's the whole argument in eight words.
The metrics in this piece are the scaffolding that gets you from a pilot to something you'd actually trust in the wild.
Task Completion Rate and What It Actually Has to Verify
Task completion rate is the percentage of runs where the agent produces a usable output without human intervention. It integrates accuracy, reliability, and safety into a single number, which makes it a reasonable starting point; it also makes it easy to game, accidentally or otherwise.
If you're measuring completion based on what the agent says it did, you're not measuring completion; you're measuring the agent's self-report. An agent can tell you it booked the flight. That doesn't mean the flight was booked. It's like a waiter who insists your order is on its way — confidence is not confirmation.
This is why benchmarks like tau-bench exist. They check the database state, not the response string. Did the record change? Did the API confirm? Did the downstream system reflect the action? That's completion. "I booked it for you!" is not.
Galileo's research puts the trust erosion threshold around 65% task completion. Below that, users stop relying on the agent. But the number hiding inside that figure is more interesting; agents hitting 60% success on a single run can drop to roughly 25% when the same task is run eight times in a row. Each run compounds the failure probability. Most benchmarks run the task once; they miss this entirely.
One more signal worth watching alongside completion rate: human override rate. When users start stepping in more often to fix or redo what the agent did, that's your earliest warning that something is degrading. It shows up before your completion score visibly moves; by the time the completion number looks bad, you've already had a problem for a while.
Pass@k and Pass^k. Measuring Reliability Across Repeated Runs
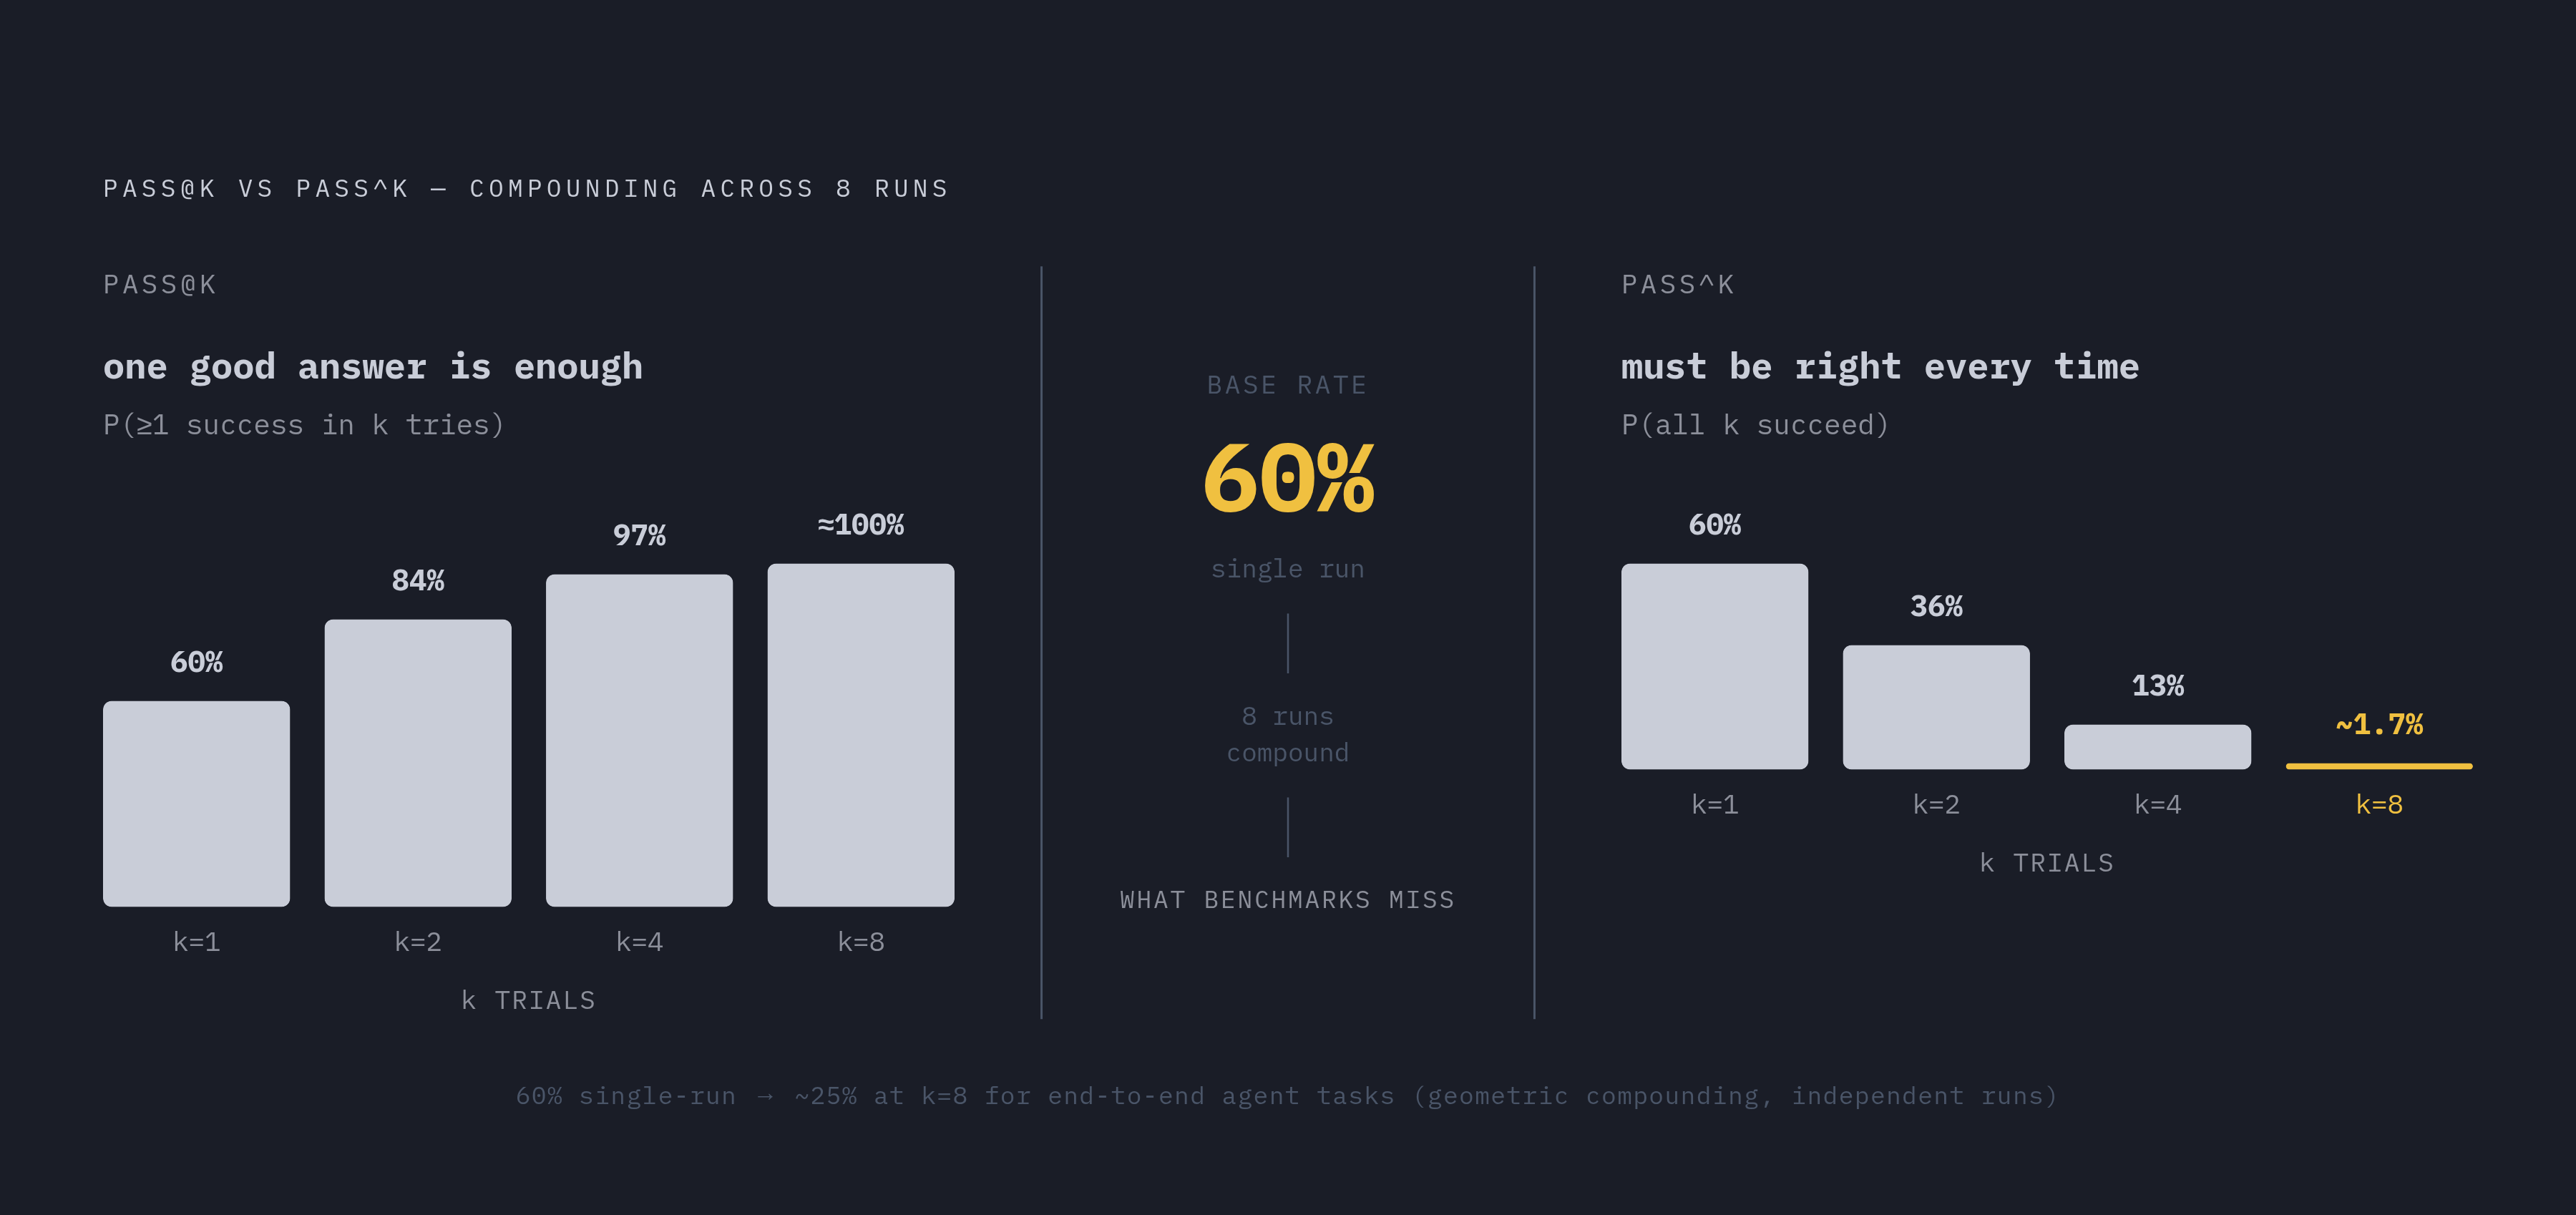
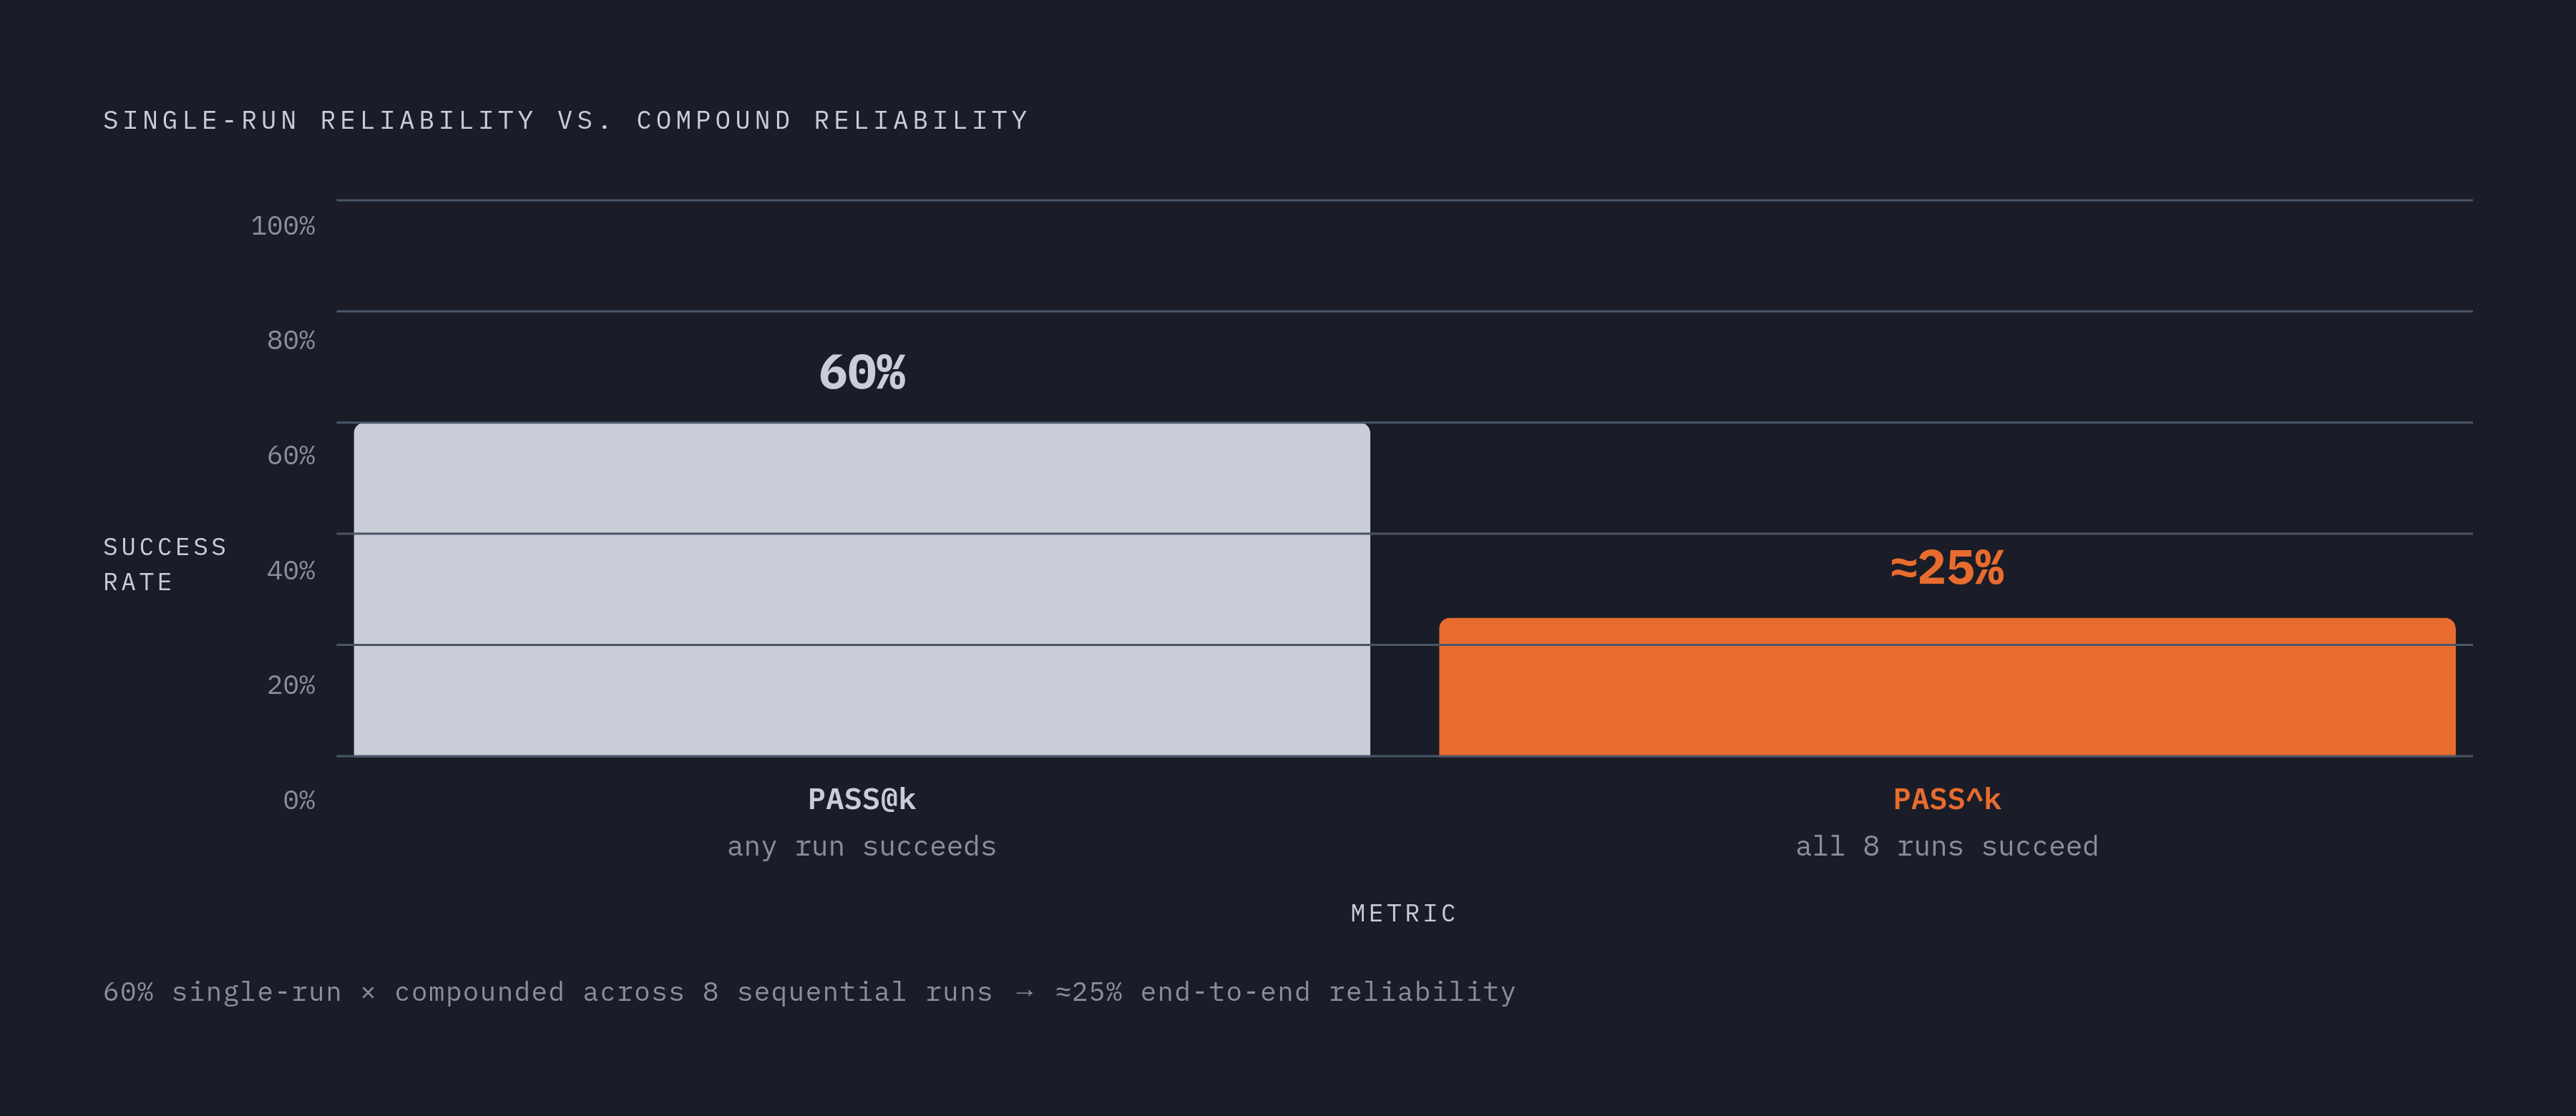
Pass@k measures the probability that at least one of k independent trials succeeds. Pass^k measures the probability that all k trials succeed. Those sound like close cousins; they are measuring very different things.
Pass@k is the right lens when one good answer is enough. Code generation, creative planning, exploratory research. You run multiple attempts, pick the best one, and move on. High pass@k means the agent can find a solution somewhere in the space; that's useful.
Pass^k is what you need when the agent has to be right every single time. Customer-facing interactions. Regulated workflows. Medical or legal contexts. High pass^k means the agent is consistently reliable, not occasionally lucky.
An agent with high pass@k but low pass^k is a great draft generator; it is not a production worker. Think of it as the difference between a slot machine that pays out if you pull the lever enough times, and a vending machine that reliably gives you what you paid for every single time. If you only measured pass@k and then deployed the agent into a workflow that demands consistent outputs, you shipped a problem without knowing it. That's the failure mode these two numbers together are designed to surface.
One good run doesn't tell you whether the agent is reliable; it tells you the agent can succeed. Those are different claims.
Trajectory Metrics. What the Path to an Answer Reveals
The final output is the last sentence of a very long story; trajectory metrics read the whole story.
Start with tool call accuracy. Not just whether the agent called the right tool, but whether it correctly interpreted the tool's schema. Agents discover tools at runtime, and if an agent misreads a schema, it can produce a plausible-sounding response while completely failing to execute the intended action. That failure is invisible in the final answer; you'd never know it happened without looking at the path.
Then look at step and loop counts. Fewer steps can mean a more efficient agent; it can also mean the agent skipped critical reasoning. The number alone tells you nothing useful. Pair it with task completion and you start to see a pattern worth investigating.
There's a distinction worth keeping straight between accuracy and faithfulness. Accuracy asks whether the output is correct. Faithfulness asks whether it's grounded in the sources the agent was actually given, rather than something the agent fabricated with confidence. These come apart constantly in practice; a fluent, confident wrong answer is the hardest failure mode to catch without trajectory inspection.
Error recovery matters too. Did the agent recognize it was off track and adjust? Or did it keep generating outputs at each step while quietly losing the thread entirely? Trajectory evaluation surfaces whether recovery happened, how many steps it took, and whether task state was maintained across turns.
One thing trajectory data won't tell you on its own: trace completion rate, meaning the agent ran to completion without crashing, is not a success metric. A very high non-crash rate says nothing about how many of those completions actually solved the user's problem; finishing is not the same as finishing correctly.
Latency and Cost. The Operational Constraints That Determine Whether a Capable Agent Is a Deployable One
A capable agent that costs too much to run or takes too long for its use case is a prototype, not a product.
Latency is context-dependent in a way that matters enormously. A four-minute response time is useless in a live customer chat; it might be completely acceptable in an overnight batch process. So the question isn't just how fast is it. It's how fast does it need to be for this specific use case, and what happens to the user experience at the slow end of the distribution.
Measure time to first action and time to completion separately. Look at latency percentiles: p50, p95, and p99 tell you different things. The behavior at p99 disproportionately shapes how reliable the agent feels to users, because the slowest experiences are the most memorable ones.
Track cost-per-task rather than cost-per-token. Total inference cost divided by number of successfully completed tasks is the number that actually matters. Failed tasks still burn tokens. The agent consumed inference on every attempt that went nowhere. The effective cost-per-success is higher than raw per-token pricing suggests, and sometimes the gap is significant enough to kill the business case.
Latency and cost also trade off against each other and against output quality. A smaller model buys speed; a larger one buys accuracy. The right operating point depends entirely on the application, which means no single metric read in isolation tells you where you should be.
Safety and Security Metrics. The Failure Surface That Most Agent Builders Don't Document
Of those 30 production agent systems in the 2025 multi-university study, only 9 had capability benchmarks reported; safety evaluation was even scarcer. Most agents in production today are running without documented safety metrics.
The threat landscape has also shifted, and not subtly. Explicit adversarial attacks, prompt injection attempts, and AI-generated malware introduced through code suggestions represent a qualitative change in what safety metrics need to catch. Building an eval for accidental failure modes and calling it done is like locking the front door and leaving the windows open.
Four metrics cover most of the failure surface:
- Policy violation rate. How often does the agent produce outputs or take actions that violate organizational or regulatory constraints?
- Injection resistance. How well does the agent deflect adversarial prompt injection attempts, the crafted inputs designed to extract hidden information or override safety controls?
- Scope adherence. Did the agent stay within its authorized tool access and data handling boundaries, or did it quietly reach for things it had no business touching?
- Error rate. What percentage of runs terminate in unrecoverable failure? This is distinct from graceful task incompletion and worth tracking separately.
Benchmarks exist specifically to probe these areas. AgentDojo targets indirect injection vulnerabilities. InjecAgent categorizes attacks by harm type. AgentHarm focuses on direct misuse. Knowing these exist and what each one tests is the baseline for evaluating production agents; skipping them is a choice, and it's one that shows up eventually.
What Benchmark Scores Do and Don't Transfer to Production
SWE-bench became the standard for evaluating coding agents. Scores kept climbing; the narrative was that coding agents were getting dramatically better. Then Scale AI released SWE-bench Pro in late 2025, replacing the original problems with harder multi-file, multi-language challenges. The best models dropped from well over half to around 23% on initial release.
The prior leaderboard was measuring something closer to benchmark familiarity than raw capability; that's a significant distinction.
On SWE-bench Pro, Claude Sonnet 4.5 and Claude Sonnet 4 now hold the highest resolve rates at the mid-forties and just above 42% respectively. The spread across models is real and meaningful. The absolute numbers tell you these are hard problems; they do not tell you that anyone has solved coding agents.
Re-analysis of the original SWE-bench found that a share of reported successes were attributable to solution leakage or weak test suites. Adding stronger automatically generated unit tests changed leaderboard rankings in a substantial fraction of cases; the test suite was doing quiet, invisible work to shape which agents looked best.
That principle applies to any internal evaluation harness you build. Your eval is only as trustworthy as the tests behind it, which means building the eval is part of the job, not something you can outsource to a leaderboard and move on.
How to Sequence These Metrics as an Agent Moves From Prototype to Production
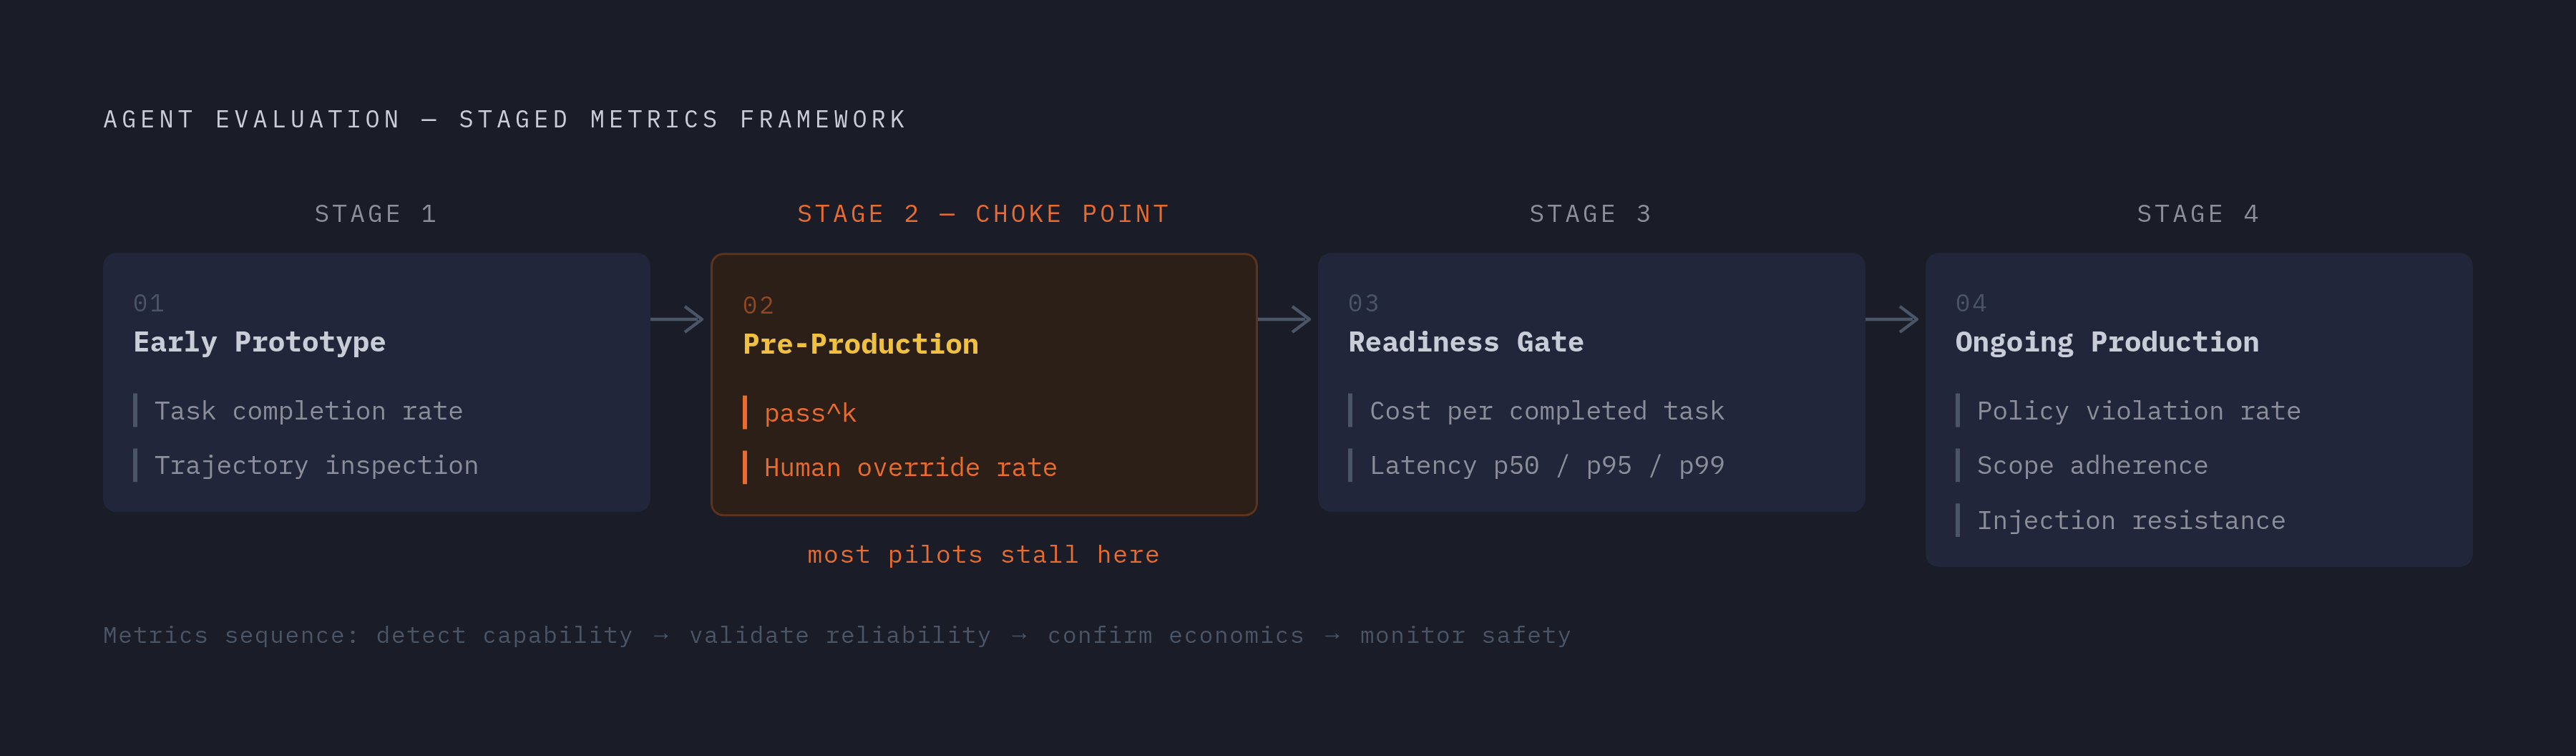
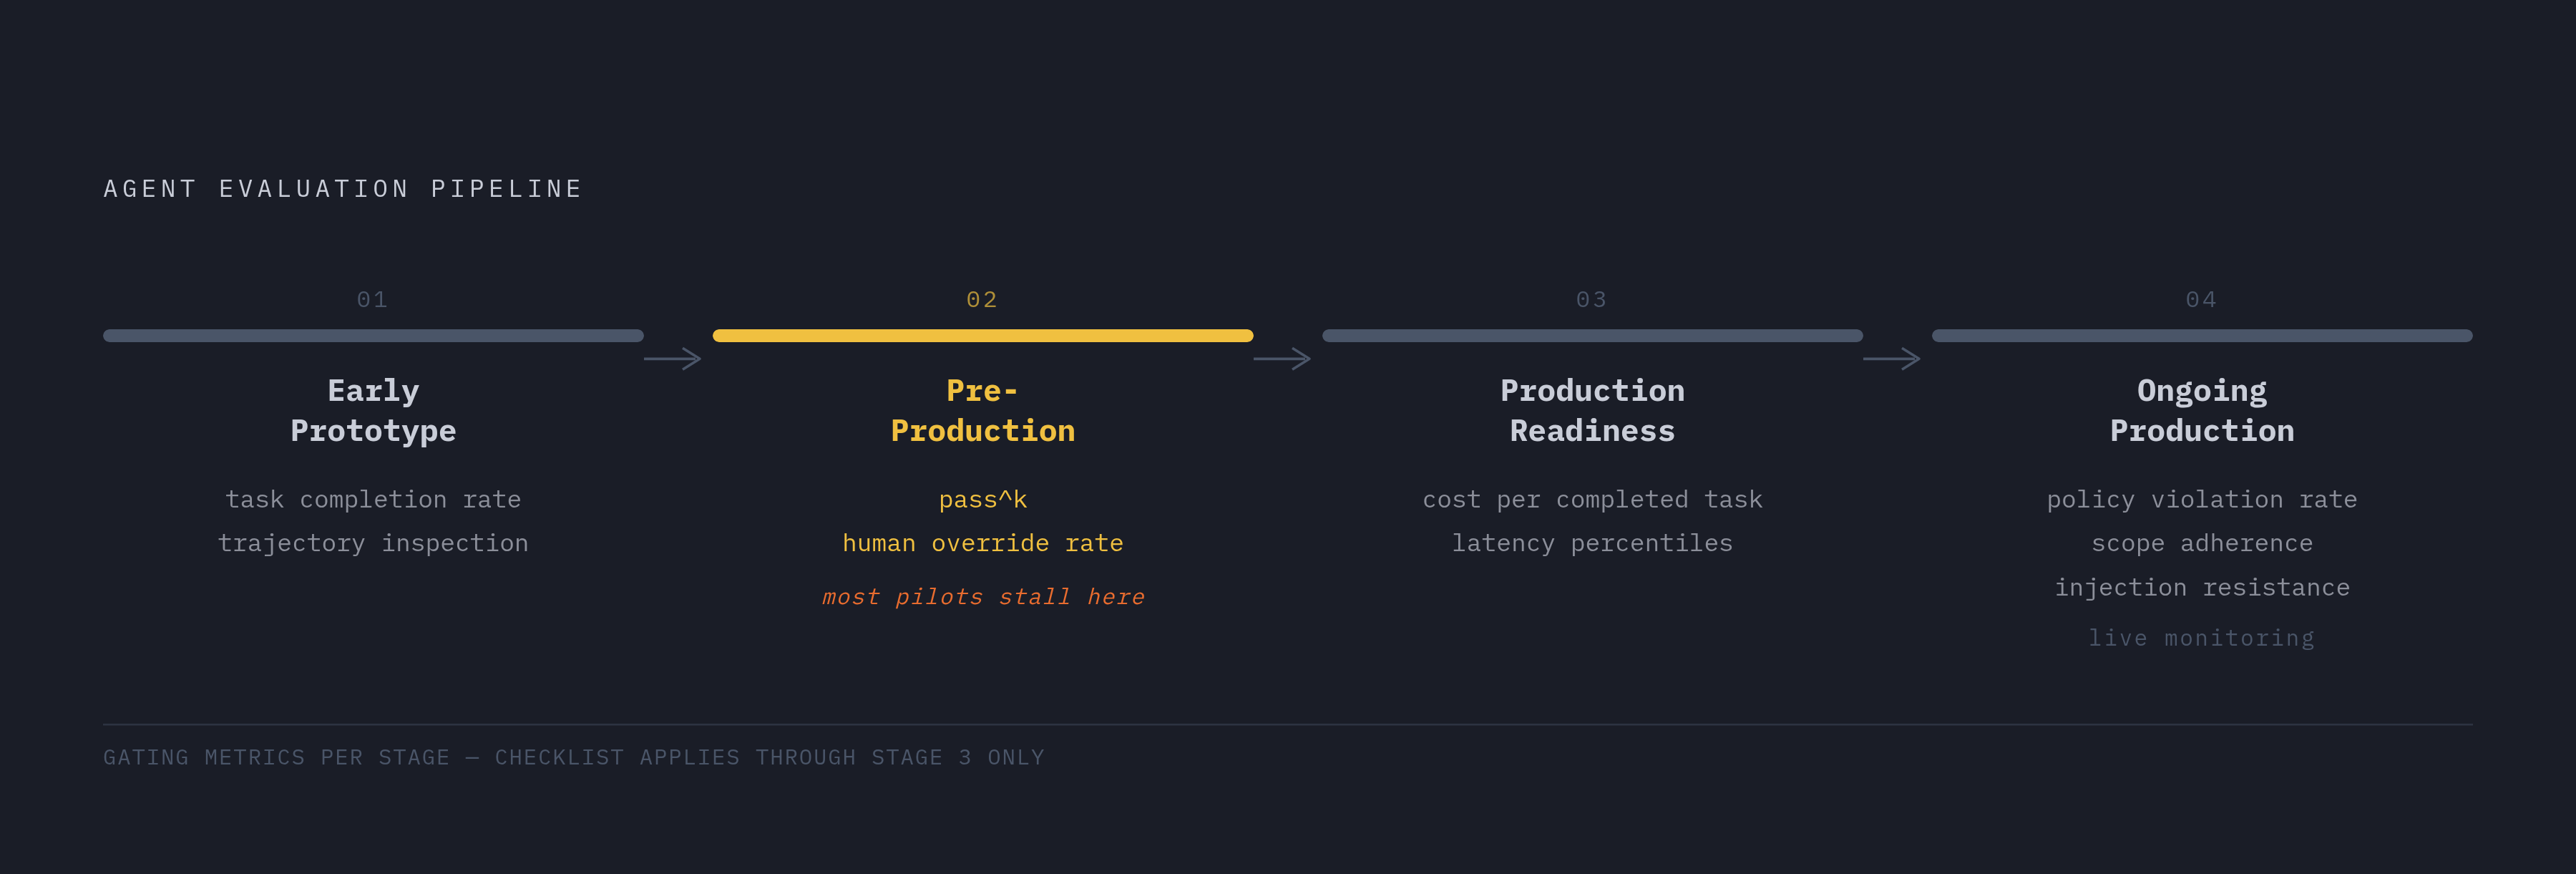
These metrics don't all need to run simultaneously from day one; the sequencing matters almost as much as the metrics themselves.
At the early prototype stage, task completion rate and trajectory inspection are your primary signals. You need to know whether the agent can do the task at all before optimizing anything else. Trajectory inspection at this stage is exploratory; you're watching what the agent actually does rather than just whether it finishes.
At the pre-production stage, pass^k and human override rate become the gate. A single-run completion score that fails to hold across repeated runs, or that requires constant human correction to be useful, is not ready to ship; this is where most pilots stall. These two metrics are usually why.
At the production readiness gate, cost-per-completed-task and latency percentiles enter the picture. A capable agent that's economically unviable or too slow for its use case is still a prototype. This is also when the benchmark question becomes practical: are the benchmarks you've been using actually representative of your production workload, or have you been measuring something adjacent to it?
In ongoing production, safety metrics shift from a pre-deployment checklist to live monitoring. The adversarial threat landscape evolves; a static safety evaluation is a point-in-time snapshot rather than a continuous guarantee. Policy violation rate, scope adherence, and injection resistance need to be tracked as the system runs rather than just verified before it ships.
The final output score misses a lot. Trajectory metrics catch process failures before they compound. Pass^k separates occasional success from dependable reliability. Cost-per-task grounds capability in the economic reality of running the thing at scale; safety metrics catch the failure modes that only appear when someone actively goes looking.
The question isn't whether you need all of these. The more useful question is which ones you're failing to track right now, and what they might already be hiding.