Observability and Tracing for Multi-Agent Systems
Traditional monitoring fails to catch silent agent failures that happen in production at scale.
Multi-agent systems break the assumptions that application performance monitoring was built on, and that break is why so many agent deployments look fine in a demo and fall apart in production. Traditional APM tools expect services that are stateless, deterministic, and honest about failure: hit an error, get a 500, page someone. Agents violate all three. They carry state across turns, they produce different outputs from the same input, and they return a clean HTTP 200 even when they've hallucinated a fact or wandered off the task entirely. This piece works through what that gap actually looks like inside a multi-agent pipeline, what needs to be instrumented to close it, and how the current generation of tools tries and sometimes fails to do that.
Start with the failure mode itself, because it's not subtle once you see it. An agent decides to call a function, the parameters come out malformed, the tool call errors out, and the agent either retries with equally bad parameters or just makes up a plausible-sounding result and moves on. None of that trips a 5xx. Nothing pages anyone. The dashboard stays green while the workflow quietly produces garbage. A UC Berkeley analysis of more than 1,600 execution traces across seven different multi-agent frameworks found failure rates as high as 86.7%, which is a big enough number that it stops being an edge case and starts being close to the median outcome for unmonitored systems. That statistic alone should reframe how teams think about instrumentation: it's not a nice-to-have layered on top of a working system. It's the only way to know whether the system is working at all.
The four places where visibility actually breaks down in agent pipelines
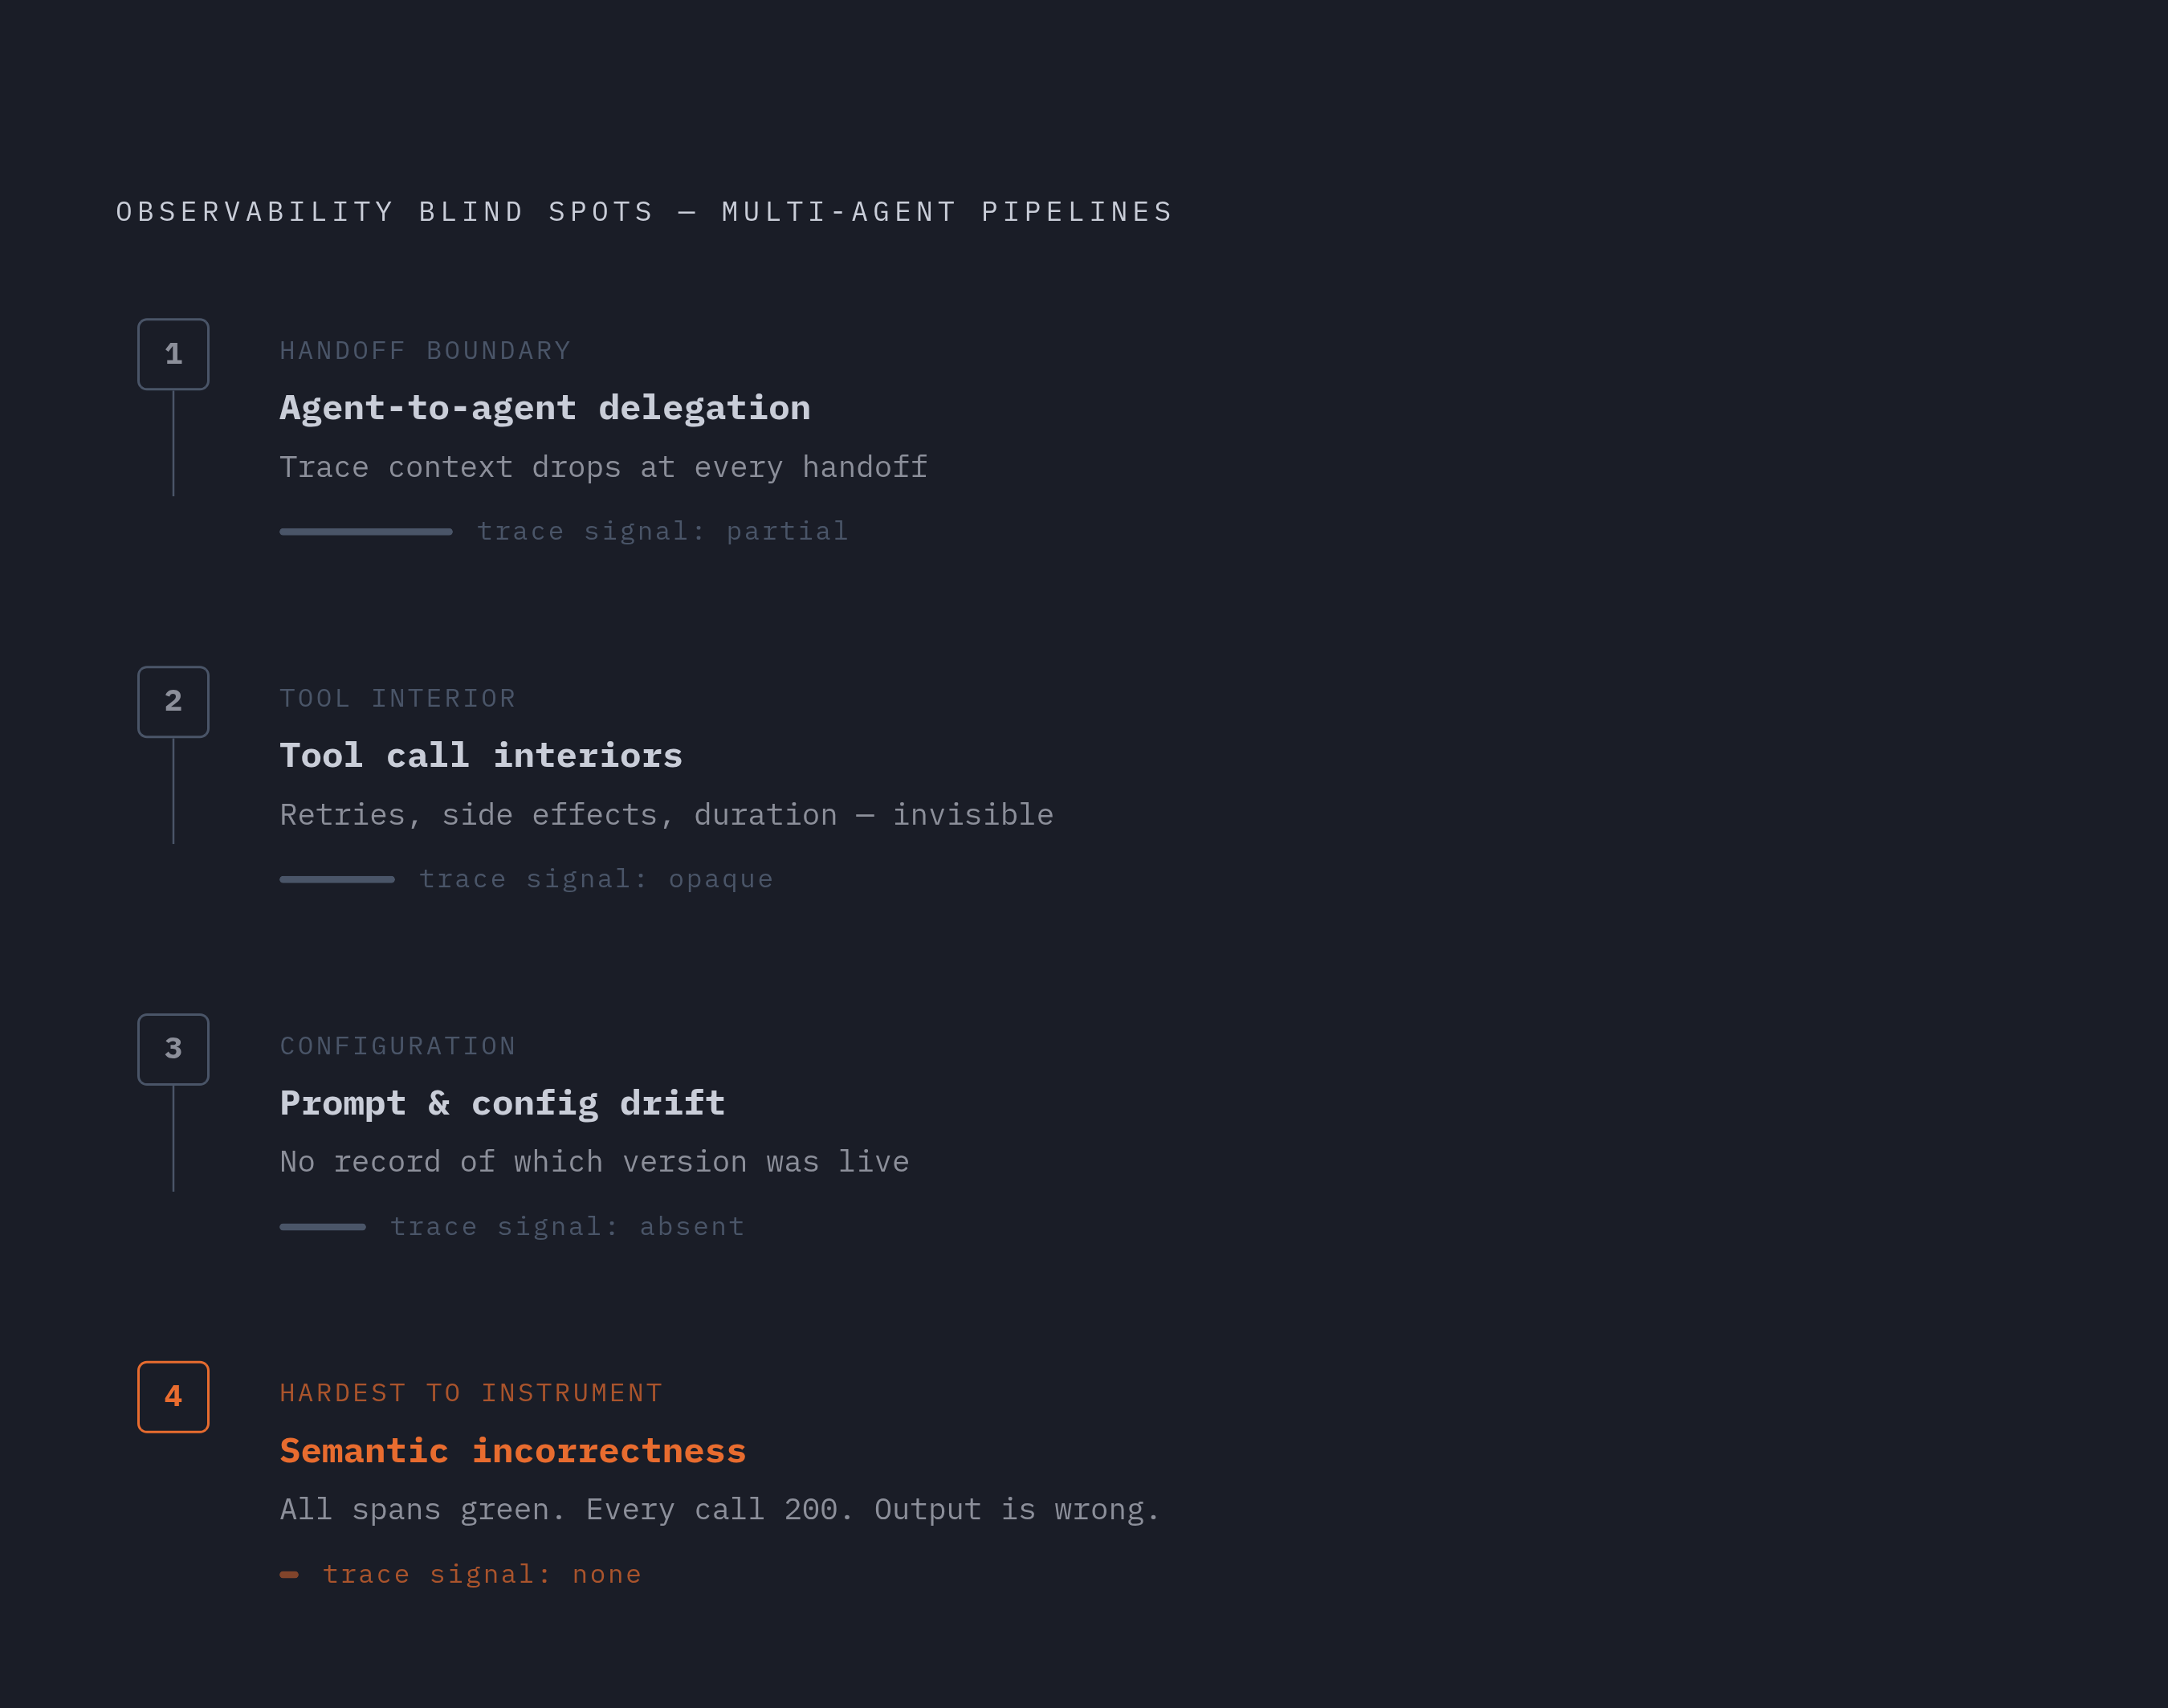
The first blind spot sits at agent-to-agent handoffs. When one agent delegates a subtask to another, the trace context has to travel with it explicitly; if that propagation doesn't happen, the downstream agent's entire execution is invisible from the upstream trace's point of view. It's as if the call simply vanished, even though real work, real tokens, and real cost happened on the other side.
The second is tool call interiors. An agent's trace usually records that a function was called, along with its parameters and its return value. What it often does not record is what happened inside that function: how long it actually took, what side effects it triggered, whether it hit a rate limit and quietly retried three times before succeeding. Unless the tool itself is instrumented, that interior stays a black box no matter how well the agent's own reasoning is logged.
Third is prompt and configuration drift. Multi-agent systems tend to have a planner, a router, and several sub-agents, and each one carries its own prompt. Change one of those prompts, even slightly, and behavior downstream can shift in ways that look exactly like a model regression but have nothing to do with the model. Without a record of which prompt version was live at a given moment, that distinction is nearly impossible to make after the fact.
Fourth, and hardest to instrument for: the difference between semantic correctness and execution success. An agent can complete every step, call every tool correctly, and return a well-formed, confident answer that is simply wrong. Traditional tracing has no concept for this. A trace that shows every span green and every call returning 200 tells you the pipeline executed; it says nothing about whether the output was actually right.
Consider what this looks like at real scale. A healthcare prior-authorization agent coordinating eligibility verification, medical necessity review, and billing code validation might involve 12 LLM calls, 8 database queries, and 5 external API calls, spread across three specialized agents. At that scale, any single uninstrumented boundary is a place where a bad decision can enter and never surface again. And the industry's track record on closing these gaps is not encouraging: a comprehensive AI Agent Index found that only 4 of 30 deployed agent systems provide agent-specific system cards, and only 9 report capability benchmarks at all. Most production deployments, in other words, have no formal transparency layer whatsoever. That's not a minor documentation gap; it's the difference between knowing what your system did and guessing.
What to instrument: the three structural layers of agent observability
Layer one is the structured trace tree, which is really about causal flow rather than just event logging. Each agent execution should be represented as a hierarchy, not a flat stream of timestamped events. Every node in that tree is a typed operation, an LLM generation, a retrieval lookup, a tool call, a sub-agent invocation, and the parent-child relationships between nodes make the causal chain explicit. You can see which LLM call triggered which tool call, and which tool call triggered which downstream agent. Without that tree structure, what you get is a timeline that shows things happened in some order, with no way to say why any of them happened.
Layer two is semantic context: a record of what the agent was thinking when it acted. This means logging the reasoning trace alongside the tool calls it produced, because that's the only real way to tell whether a bad outcome came from a model error, a prompt error, or bad input data. Prompt content, completion content, tool parameters, and tool results need to be captured as structured attributes on spans, not dumped into free-text logs. That distinction matters more than it sounds: free-text logs are fine for a human scrolling through an incident after the fact, but they're useless for automated evaluation or search across thousands of traces. Structured data is what lets a later system ask "how many times did this agent call the same tool with the same bad parameter" and actually get an answer.
Layer three is cross-agent correlation, the connective tissue across the whole graph. Trace context has to propagate explicitly across every agent boundary, with each sub-agent invocation carrying its parent trace ID forward. On top of that, session-level identifiers group every trace belonging to a single user interaction or workflow run into one coherent unit. Skip this and individual agent traces become islands: you can debug one agent's behavior in isolation, but you cannot reconstruct what the system as a whole actually did.
None of these three layers substitutes for the others, and there's a parallel split worth noting between step-level and trace-level metrics. Step-level metrics cover latency per LLM call, tokens consumed, tool call success and failure rates, retry counts. Trace-level metrics cover end-to-end latency, total token cost for a full workflow run, and overall task completion rate. A platform that only gives you one is a trace viewer good for debugging a single bad run but useless for measuring quality trends across the thousands of runs a production system generates in a week.
Where the OpenTelemetry GenAI conventions help and where they stop short
OpenTelemetry's GenAI Special Interest Group formed in April 2024, originally scoped narrowly around tracing calls to LLM clients. The scope has since grown to cover agent orchestration, MCP tool calling, content capture, and quality evaluation, six layers in total, which tells you something about how fast the field's own understanding of what needs tracing has expanded.
What the semantic conventions actually standardize is fairly concrete. There's gen_ai.request.model for which model got called, gen_ai.usage.input_tokens and gen_ai.usage.output_tokens for token counts on each LLM call, and gen_ai.response.finish_reasons for why generation stopped. When teams opt into content capture, prompts, completions, tool call parameters, and tool results all get recorded as structured span attributes, which lines up directly with the semantic-context layer described above. As of spec version 1.41, the conventions also define distinct span types for agents, workflows, tools, and models, along with required metrics for latency and token usage. That's real standardization, and the industry is adopting it where it counts: the CNCF backs the spec, and Google Cloud, AWS, Azure, and Datadog have all adopted it, which is a strong signal it's becoming the common language for AI telemetry rather than one vendor's proprietary format.
But here's where it's worth pausing before treating this as settled. As of May 2026, the GenAI and MCP semantic conventions remain in Development status, and nearly every gen_ai.* attribute still carries a Development stability badge. That means attribute names can change without a major version bump, which is a real operational risk if a team builds ingestion pipelines that assume today's field names are permanent. The practical response is to build tolerance for renaming into the ingestion layer, pin SDK versions deliberately, and keep an eye on the spec changelog rather than assuming set-and-forget.
There's also a boundary worth being clear about: OpenTelemetry does not cover output evaluation, safety scoring, or content quality assessment. The spec is the data plane. It tells you what happened and in what shape, not whether what happened was good. A proposal currently sitting in the OpenTelemetry semantic-conventions-genai repository extends the model further, introducing conventions for tasks, actions, agents, teams, artifacts, and memory, with tasks treated as the smallest trackable unit that can be broken into subtasks. That's a promising direction, but it remains a proposal, not a ratified standard, so teams shouldn't build production dependencies on it yet. The practical position for now: instrument with OTel's GenAI conventions for portability and to avoid vendor lock-in, but plan on the evaluation layer living somewhere else entirely.
How the major observability platforms handle multi-agent tracing in 2026
The platforms in this space split along two axes worth keeping in mind while comparing them: how deep the trace capture goes versus how deep the evaluation tooling goes, and whether the platform is self-hosted or managed. Which axis matters more depends entirely on which gap is hurting a given team.
Langfuse sits on the open-source, self-hostable end. It bundles traces, sessions, prompt versioning, cost tracking, datasets, and evaluations into one package, and supports both its own SDKs and OpenTelemetry directly, so teams already emitting OTel spans can route them straight in. It's the natural fit for teams that want to own their data and don't mind running their own infrastructure.
LangSmith, from the LangChain team, reached full OpenTelemetry support in March 2026, adding real-time dashboards, alerting, and conversation clustering along the way. Pricing runs a free Developer plan with 5,000 base traces a month, a Plus tier at $39 per seat per month, and usage-based trace costs of $0.50 per 1,000 base traces or $2.50 per 1,000 for extended traces with 400-day retention. It works best for teams already built on LangChain or LangGraph, where the trace-to-prompt-debugger loop is genuinely tight, though that tightness comes with a real dependency on the broader LangChain ecosystem. Worth flagging directly: LangSmith gives a detailed trace of a bad decision, but it does not, by itself, tell you whether that decision came from model error, prompt error, or bad input data. Capturing the reasoning trace well enough to make that call is still the team's job, not the platform's.
AgentOps takes an agent-specific approach, built around session replay and multi-agent workflow visualization, with a lightweight integration surface meant to slot into an existing agent stack rather than force a rewrite.
Arize and Phoenix address tracing and evaluation concerns across two layers: Phoenix handles tracing, and Arize provides the managed evaluation and monitoring layer, letting teams define their own evaluation criteria rather than accepting a fixed rubric.
Braintrust is built around closing the loop between traces and evals directly. It ships a GitHub Action that runs evaluations on every pull request, posts the results, and can block a merge outright if agent quality has dropped. Production traces convert automatically into reusable eval cases, so the evaluation suite grows out of real failures rather than someone manually exporting examples after an incident. Notion used Braintrust's observability and eval tooling to take issue triage from roughly 3 issues a day to 30, and the platform is in production use at companies including Stripe, Vercel, Zapier, Airtable, and Instacart.
That Braintrust example points to the differentiator worth weighing when choosing a platform: the trace-to-eval feedback loop. Observability earns its keep when a production failure automatically becomes a regression test case, rather than sitting in a dashboard as a data point nobody revisits. Platforms that close this loop cut down the manual translation work between "something broke" and "we now have a test that catches it next time."
How the execution environment shapes what observability can see
Instrumentation assumes the thing it's watching is stable enough to emit reliable telemetry in the first place. An agent that gets killed mid-task, loses its state, or restarts inside an environment nobody's tracking produces a trace with holes in it, and holes in a trace are not the same as a clean trace showing a clean run; they're often indistinguishable from missing data, which makes the whole record unreliable.
Long-running agents make this sharper. A workflow spanning hours or days across multiple sessions cannot be pieced back together from a series of independent per-request traces; it needs execution infrastructure that actually preserves state between invocations, so the trace reads as one continuous story instead of a stack of disconnected fragments.
Sandboxed execution adds its own wrinkle. Code running inside an isolated environment has to be able to emit spans outward, and if the sandbox itself behaves like a black box, tool call interiors stay invisible no matter how carefully the rest of the pipeline is instrumented. The instrumentation strategy and the execution environment are not separate concerns here; they're the same problem viewed from two sides.
Three infrastructure properties make the difference between a system that's observable and one that only looks observable. Persistent state means an agent resumes exactly where it left off, so its trace stays continuous through restarts instead of fragmenting. A transparent execution surface means the runtime itself isn't a hidden layer; open, auditable infrastructure lets a team instrument at whatever layer they need to, instead of hitting a wall at the runtime's edge. And isolation without opacity means sandboxes can still protect the host from untrusted code while exposing a telemetry path outward, so spans generated inside the sandbox rejoin the parent trace rather than disappearing into it.
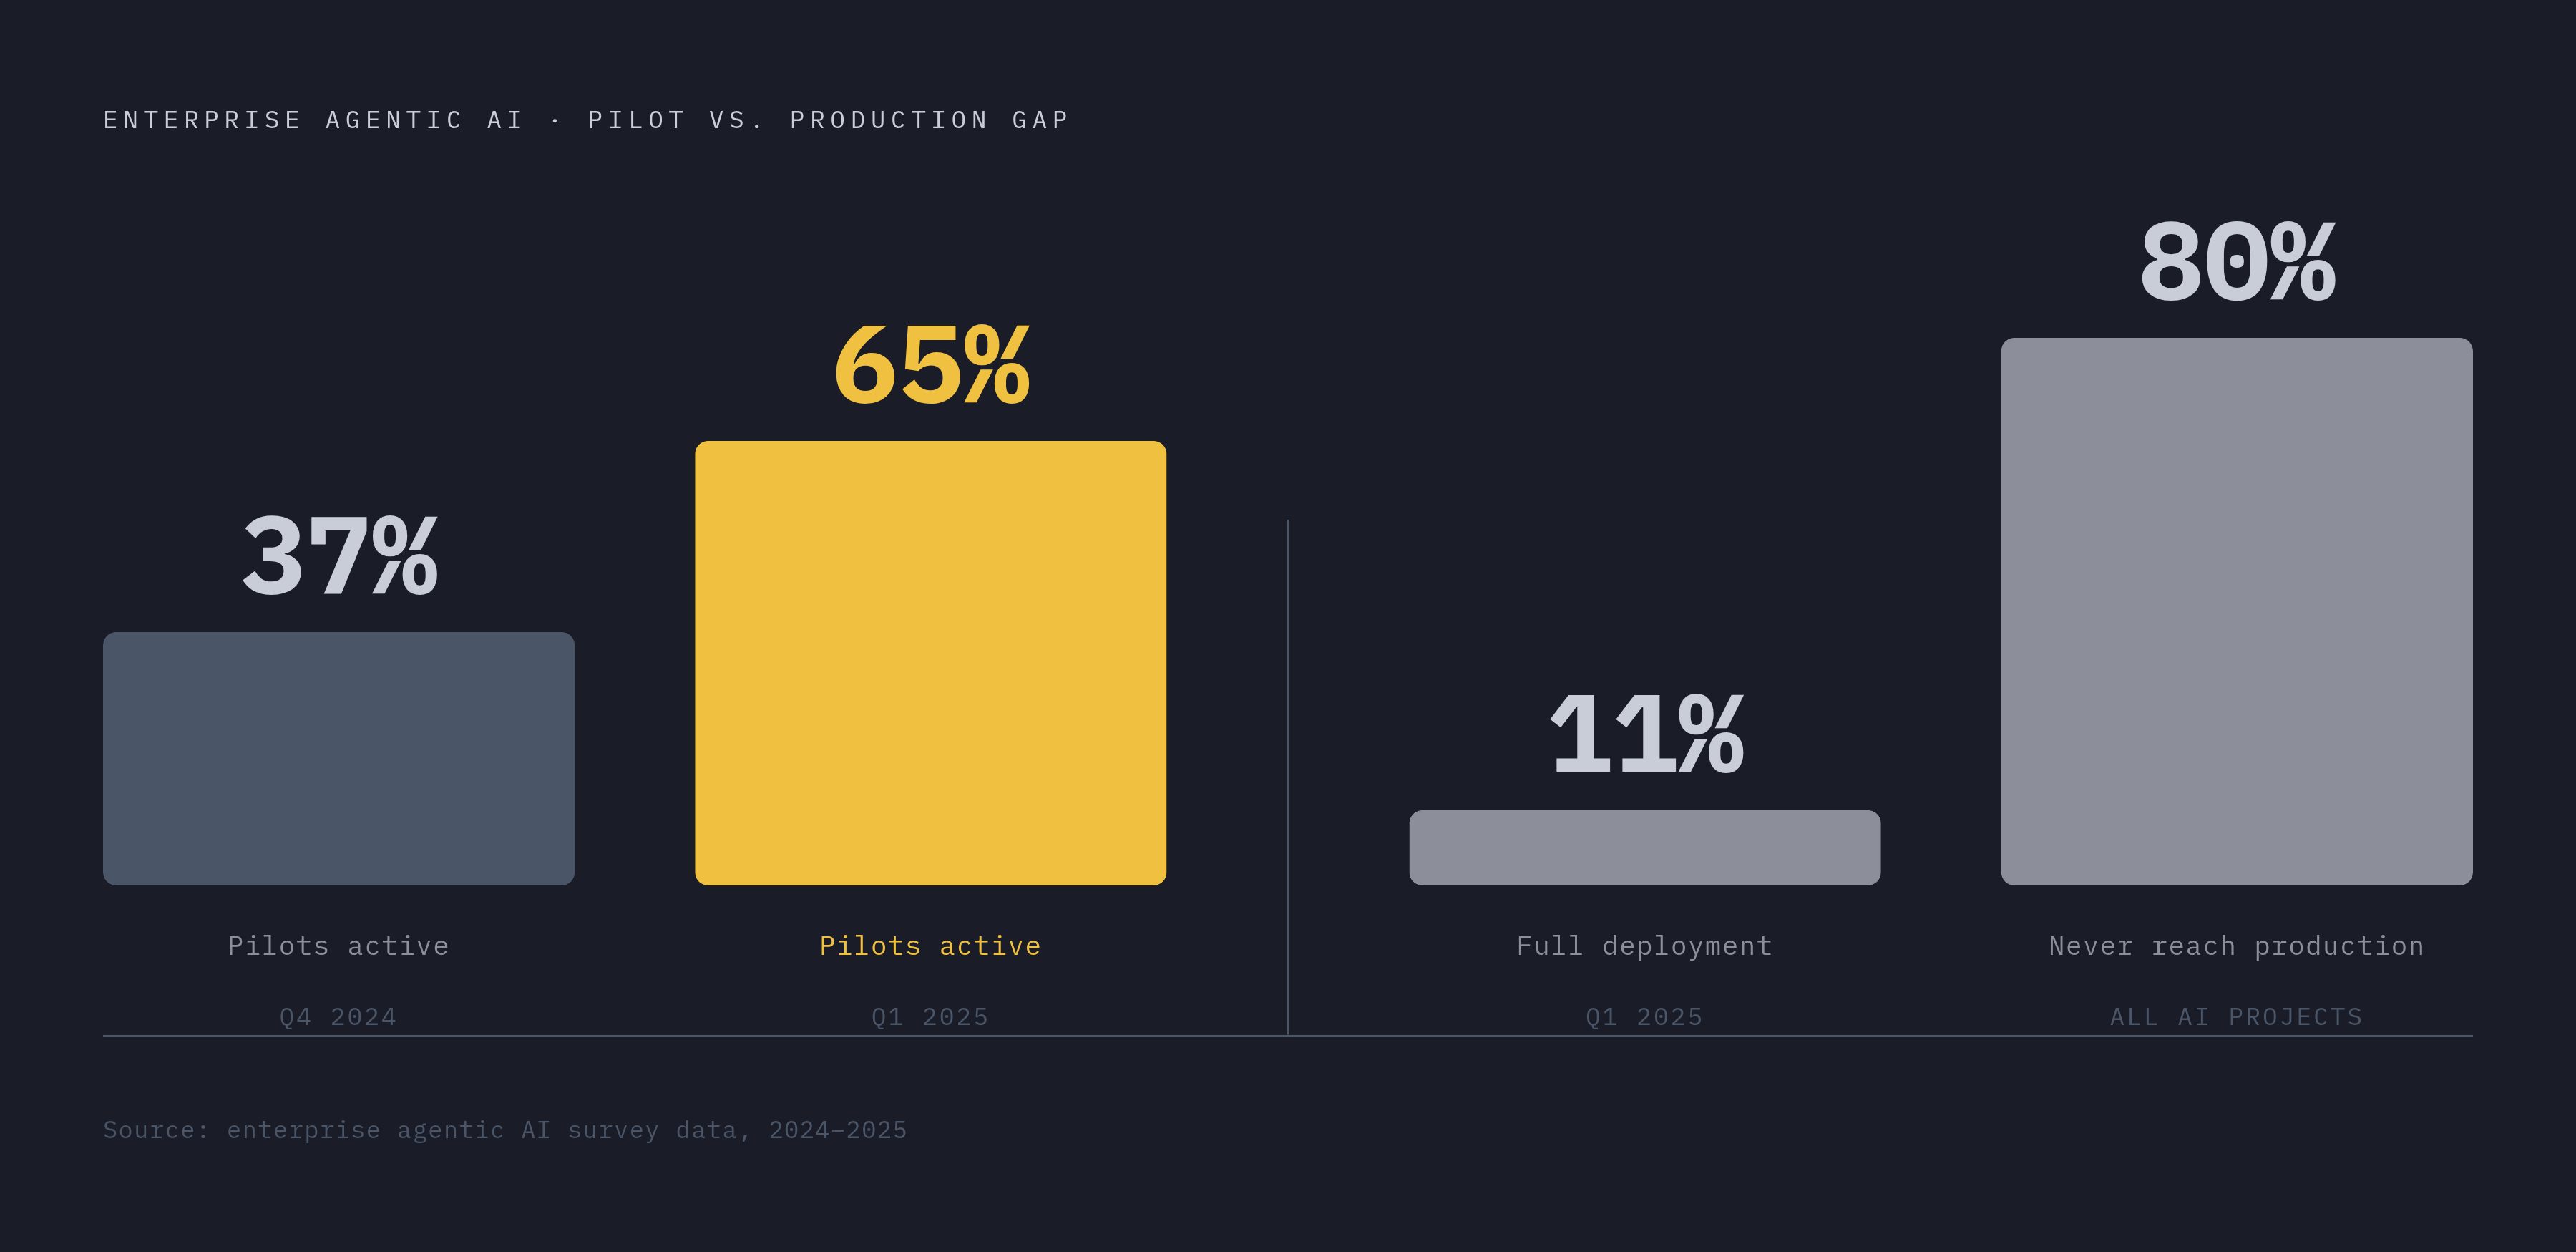
The scale of the deployment gap this creates is worth sitting with. Enterprise pilots of agentic AI nearly doubled in a single quarter, from 37% in Q4 2024 to 65% in Q1 2025, yet full deployment has stayed flat at around 11%, and more than 80% of AI projects never reach production at all. Weak infrastructure drives that stall. Observability tooling, however well designed, cannot close that gap on its own if the runtime underneath it was never built for long-running, stateful, multi-agent workloads. The instrumentation layer and the execution layer have to be designed together, or the instrumentation just documents failures more precisely without preventing any of them.
Building the feedback loop from traces to improved agent behavior
Most teams that adopt tracing hit the same wall eventually: they have traces, plenty of them, but no actual process for turning a bad trace into a better prompt, a fixed configuration, or corrected agent logic. The traces accumulate. Nobody acts on most of them. That's a process gap, and it's the gap that separates teams running a real feedback loop from teams running an expensive trace archive.
The trace-to-eval cycle is the operational answer to that gap. It starts with identifying failure traces in production, wrong outputs, tool calls that took an unexpected path, sudden cost spikes, latency that jumps for no obvious reason. Those failures get converted into labeled evaluation cases: what actually happened, and what should have happened instead. From there, every subsequent change touching the affected component, a prompt edit, a model swap, a tool update, gets run against that growing eval set before it ships. Deploys get gated on the results, so a regression gets caught in CI rather than discovered by a user three weeks later.
Prompt versioning is what makes this cycle actually traceable back to a cause. When a trace shows a regression, the team needs to know precisely which prompt version was live at that moment and what changed since the last known-good version; without that record, the trace is a symptom pointing at nothing in particular.
Token and cost tracking function as a parallel early-warning signal, often ahead of any quality metric. A sudden jump in token cost per workflow run frequently means an agent has started looping, retrying more than it should, or receiving unexpectedly large tool responses, and that kind of anomaly tends to show up in the cost numbers before it shows up as a wrong answer anyone notices.
The stakes here aren't abstract. Gravitee's State of AI Agent Security report put the incident rate among organizations running AI agents at 88%, which makes this feedback loop a practical necessity. Teams without it tend to find out about failures from user complaints, not from monitoring, which is the exact inversion of what observability is supposed to provide. Production-ready observability, in the end, isn't a dashboard someone checks in the morning. It's a closed loop: every production failure has a path to becoming a regression test, and every regression test has a path to actually blocking a bad deploy before it ships.