GPU Memory Limits and OOM Handling in Agent Sandboxes
KV cache grows uncontrollably across agent turns, making memory planning fundamentally different.
GPU memory limits and out-of-memory failures carry a distinct, compounding character in agent sandboxes, driven by bursty VRAM demand, persistent KV cache, and execution loops that never really stop. Agents don't work that way. A single user task might trigger a sequence of model calls, one for routing, another for retrieval planning, another for tool selection, then synthesis, then validation, then repair, and each of those calls adds prompt tokens to a running context while holding memory resident during generation.
Three pressures compound to make this categorically harder than standard serving. Bursty VRAM demand comes from parallel tool calls and multi-step reasoning happening in overlapping windows. Persistent KV cache grows with every turn of context, never resetting the way it would in a stateless chat exchange. And continuous execution loops mean there's rarely a clean point where the system can safely evict memory without breaking something downstream.
Understanding why the agent case differs matters before any of the detection or recovery mechanics make sense. A GPU running a chatbot can afford to be wrong occasionally: a dropped request gets retried, the user barely notices. A GPU running an agent mid-task has no such grace. Memory pressure that builds slowly across twenty turns of a coding session looks nothing like a spike, and the tooling has to be built for that shape of failure, not the traffic-spike shape most inference stacks were designed around. Contrast with standard LLM serving: chatbots reset per query, while agents accumulate state across turns.
KV cache as an uncontrolled VRAM consumer in multi-turn agent sessions
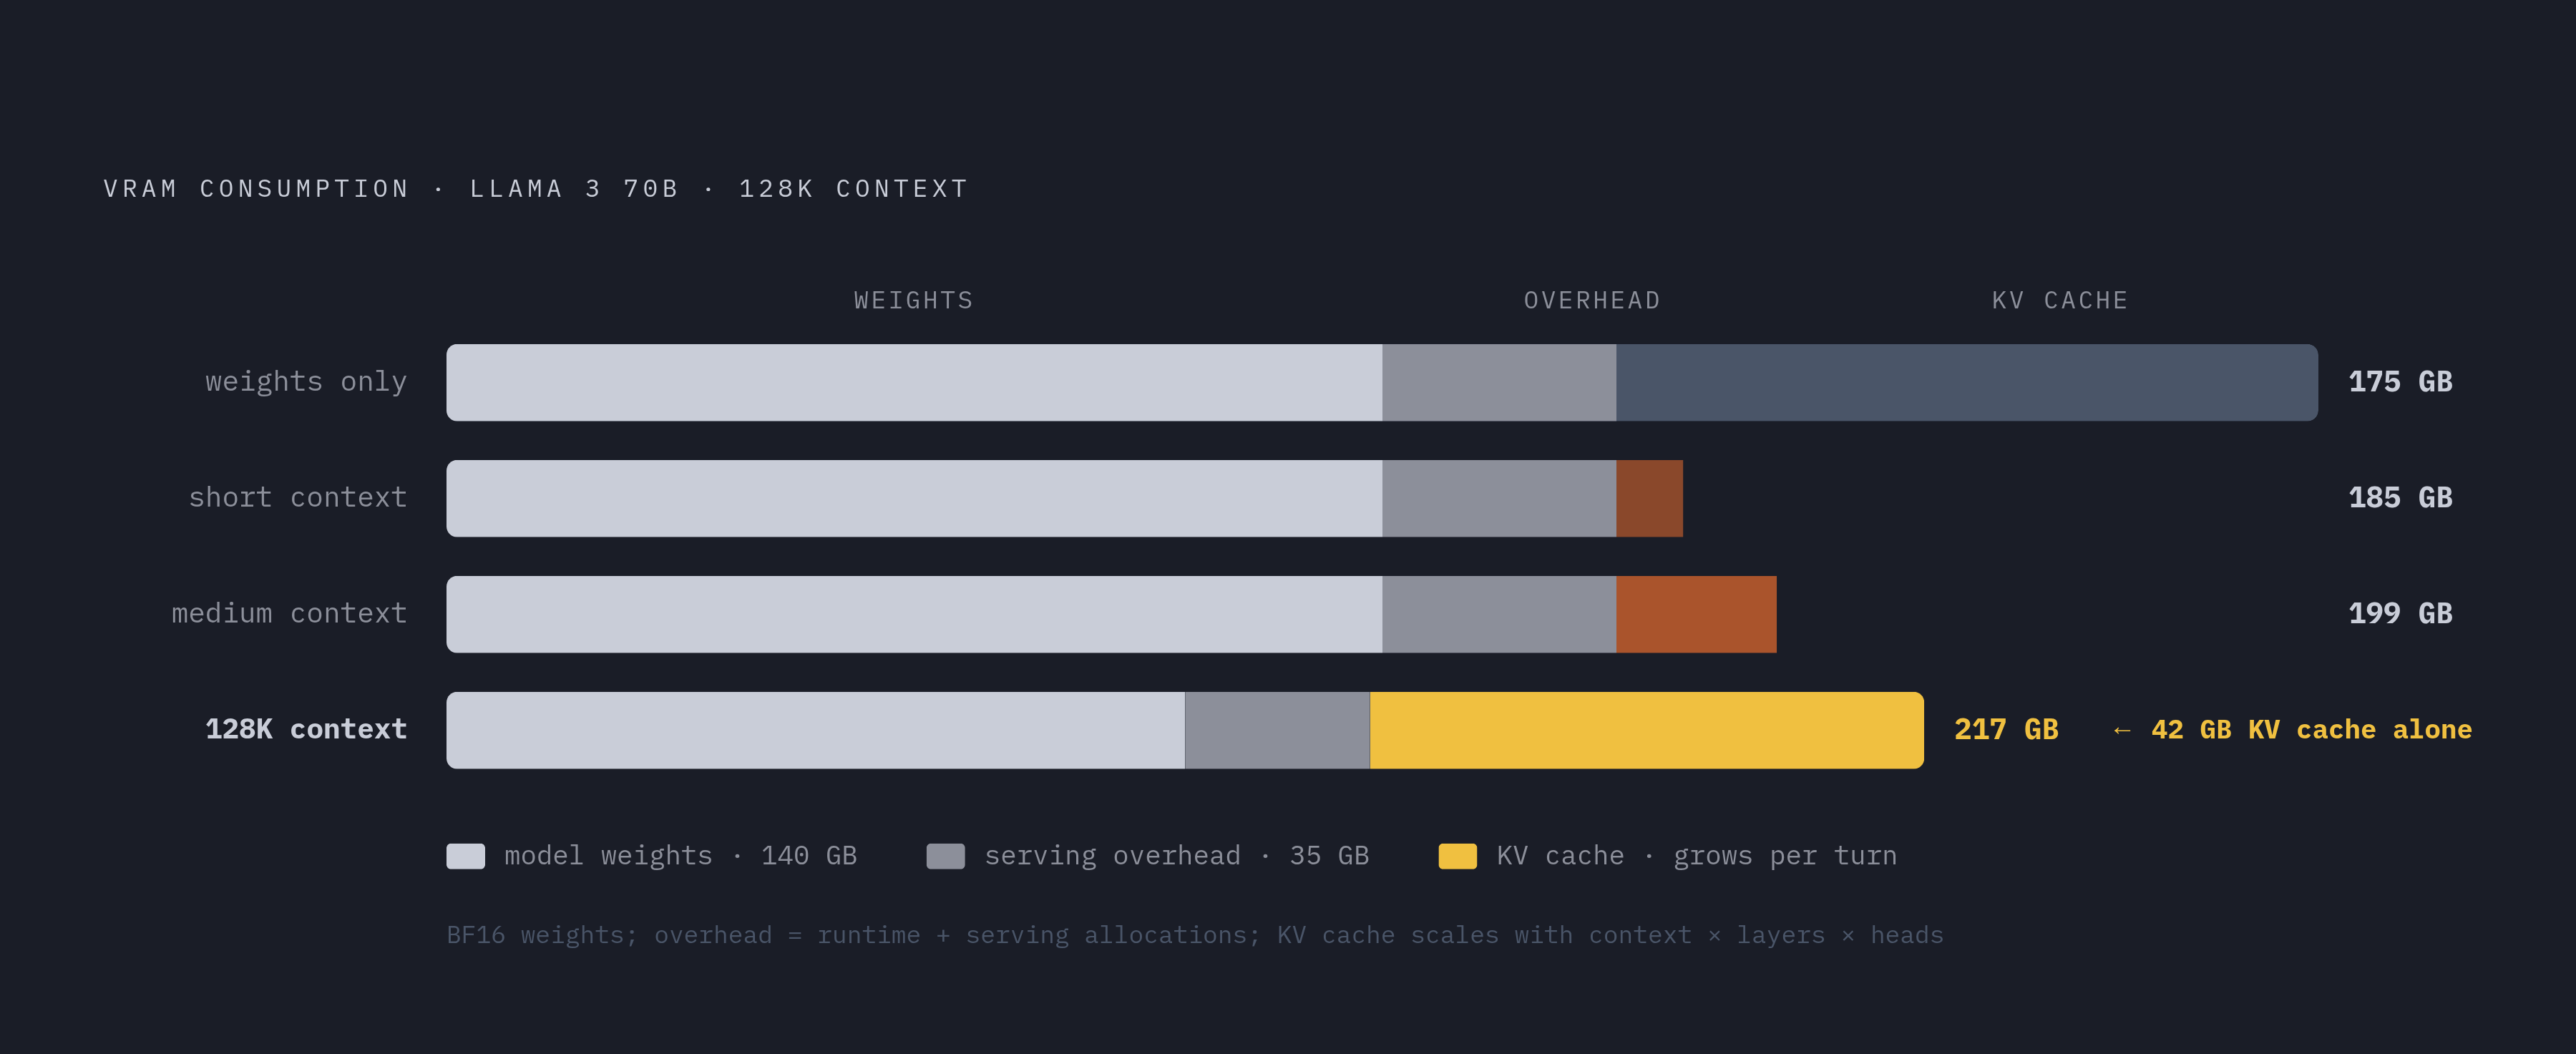
Every token sitting in a model's context window needs its key-value pairs stored for every attention layer the model has, and that storage cost scales with context length, model size, and the number of turns accumulated so far. One Llama 3 70B request running at 128K context needs 42GB of VRAM for the KV cache alone, before a single byte of model weights is loaded spheron.network. That's not a hypothetical edge case. Long-context agent sessions, document analysis, multi-hop reasoning, SWE-bench-style coding tasks, fill context windows fast, and once they do, paging KV state to CPU or NVMe avoids OOM but adds meaningful latency per eviction.
Paging works, but it isn't free. vLLM's answer is CPU swap space, configured with a flag like --swap-space 32, which reserves a chunk of system RAM as a secondary tier for KV cache. Without that swap space configured, vLLM's default behavior when the GPU cache fills is to queue or reject incoming requests outright, which in an agent context means a broken tool chain and a failed task. With it, requests survive, but each eviction adds latency, so the tradeoff isn't between fast and slow, it's between slow and dead.
Production teams serving large frontier models handle this by tuning cache block size, prefix cache hit rate, and continuous-batching limits on a per-route basis, using vLLM's PagedAttention or SGLang's RadixAttention as the underlying mechanism. Academic work is chasing the same problem from a few different angles. MemDecay proposes region-aware eviction, deciding which parts of the cache matter enough to keep. CommitKV takes a lifecycle view, compressing KV cache through commit transitions specifically built for multi-turn agent sessions. None of this is production-standard yet, but the direction is clear: KV cache isn't a fixed cost you provision once and forget.
That is the core implication. KV cache is not a static allocation, it expands with every agent turn, which makes it the primary vector for gradual VRAM exhaustion rather than one dramatic allocation event. A session can look perfectly healthy at turn one and be sitting on the edge of an OOM by turn twenty, purely because the context kept growing while nobody was watching the growth rate. Emerging academic work, a 2026 preprint cluster, is documented in the UNISON paper arXiv:2609.09643. GraniKV (arXiv:2608.15584) offers asymmetric granularity KV-cache paging for multi-agent systems with long shared prefix, as discussed in Opal: Private Memory for Personal AI, and in The GPU Guide to Running Private AI Agents Locally in 2026, and in Beyond Static Sandboxing: Learned Capability Governance for Autonomous AI Agents. TOPAS (arXiv:2608.25523) provides workflow-aware prefix-state scheduling for multi-agent LLM serving.
VRAM sizing baselines before any isolation layer is designed
Before any isolation strategy gets chosen, the underlying math needs to be right, and that math is additive. Model weights, serving overhead, and KV cache budget all draw from the same VRAM pool, and none of them can be sized independently of the others. A workable rule of thumb: take the FP16 model weight footprint, add 15 to 30 percent for serving overhead and KV cache, then add another 10 to 15 percent for the inference runtime itself, covering the vLLM process and CUDA context Opal: Private Memory for Personal AI The GPU Guide to Running Private AI Agents Locally in 2026 Gartner Beyond Static Sandboxing: Learned Capability Governance for Autonomous AI Agents.
Quantization changes the picture substantially. But that math shifts hard once context length grows. Long-context, reasoning-heavy agents working past 32K tokens are better served by something like an H200 with its 141GB of HBM3e, or a B200 where available, sized specifically so the KV cache stays resident in VRAM instead of spilling out to host memory spheron.network.
Headroom affects whether the system can absorb bursty demand without failing, and it matters more than the raw total for that reason. If a budget calculation is 48GB, the safer move is sizing for 80GB, because running at 95 percent VRAM utilization in a production agent workload is operationally unsafe given how bursty the demand curve gets Gartner. Precision format adds another lever. Switching from FP16 to FP8 on Blackwell doubles throughput while halving the VRAM footprint, and dropping to FP4 cuts the footprint to a quarter of the FP16 baseline, though Ampere-generation GPUs like the A6000, A5000, and A100 have no native FP8 support spheron.network State of AI Agent Memory 2026.
Why does all this sizing work have to happen before isolation gets designed? Because sizing determines which isolation profile is even possible. A 10GB MIG slice simply cannot host a 42GB KV cache session, no matter how cleverly it's configured spheron.network. Get the sizing math wrong upstream, and every isolation decision downstream is built on sand. Quantization reduces weight footprint substantially: a 7B-parameter model in 4-bit occupies approximately 4–5 GB, and a 16–24 GB GPU covers most serious local agent workloads at 14B–32B parameter scale.
Isolation boundaries of the three GPU sharing models
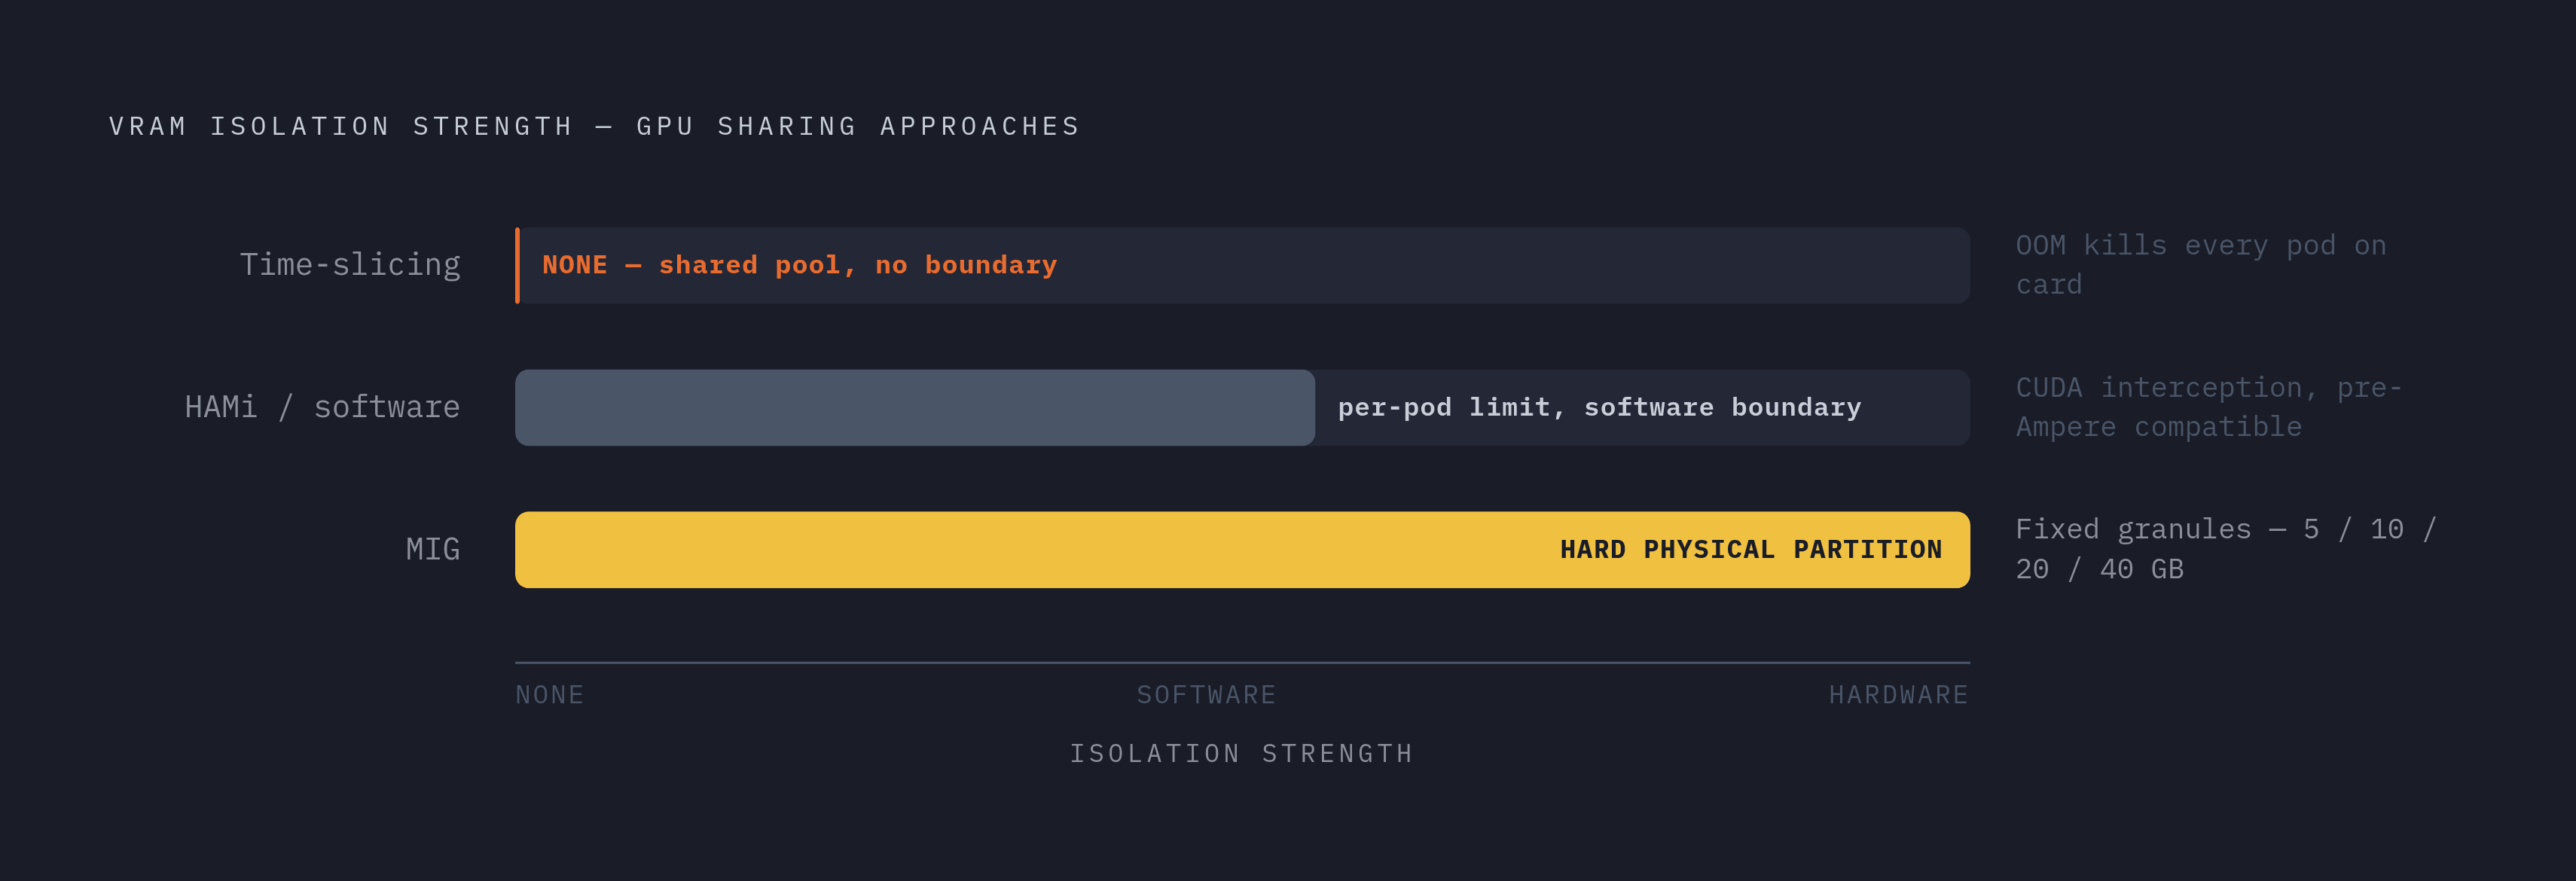
Three approaches dominate GPU sharing for agent sandboxes, and they solve different problems. What it does not do is isolate VRAM. Time-slicing is a poor fit for long-running agent sessions where KV cache keeps accumulating.
MIG, Multi-Instance GPU, takes a fundamentally different approach available on Ampere, Hopper, and Blackwell architecture cards including the A100, A30, H100, and H200. An H100 SXM5 supports up to seven MIG instances at the 1g.10gb profile, which hands each sandbox 10GB of dedicated VRAM alongside a dedicated SM partition spheron.network. Memory comes in fixed granules, typically 5GB, 10GB, 20GB, or 40GB on an 80GB A100, each backed by dedicated ECC-protected VRAM spheron.network. Because the partition is physical, a noisy neighbor in one slice cannot cause memory corruption or cache thrashing in another, and if a process inside a partition exceeds its allocation, the OOM-killer terminates that process alone, leaving every other partition untouched. That makes MIG the right fit for concurrent sandboxes running longer jobs where VRAM isolation actually matters, and it pairs well with VFIO passthrough into microVMs through MIG device node binding.
The third approach skips hardware partitioning. Software-layer interception, implemented through projects like HAMi (a CNCF Incubating project formerly known as k8s-vGPU-scheduler), intercepts CUDA allocation calls such as cuMemAlloc_v2, cuMemAllocManaged, and cuMemAllocHost_v2 before they ever reach the driver. Each pod only sees the VRAM it requested, and an over-allocation attempt returns CUDA_ERROR_OUT_OF_MEMORY directly rather than silently succeeding and starving a neighbor. The check itself is simple arithmetic: current pod VRAM usage plus the current request, measured against a configured limit per device index. Because this approach needs no driver changes and no application changes, it works on any standard NVIDIA GPU, including pre-Ampere cards where MIG isn't an option at all.
So which one fits which job? MIG suits compute-heavy sandboxes that need guaranteed VRAM and SM isolation. Time-slicing suits bursty, short-duration executions where concurrency risk is low. And SWE-bench and full-model workloads that need the entire memory envelope of a card are usually better served by a dedicated GPU per sandbox rather than any shared model at all. Time-slicing is an NVIDIA official approach. Spheron.network reports that it provides no VRAM isolation, so a runaway sandbox that allocates all VRAM on an 80GB H100 OOM-kills every other sandbox on the same card. Hardware-level partitioning physically divides SMs, L2 cache, and DRAM bandwidth rather than software-virtualizing them.
Compounding OOM failures in shared GPU sandboxes
Trace the failure path in a time-sliced environment and the pattern becomes clear fast. One sandbox's KV cache grows without bound, it exhausts the shared VRAM pool, and the kernel's OOM-killer fires, potentially terminating processes across every sandbox sharing that card, not just the one that caused the problem. That's the multi-tenancy nightmare in miniature: one bad actor, intentional or not, takes down neighbors that did nothing wrong.
Agent workloads make this worse in a specific way. Most workloads have a natural boundary where memory gets released, the end of a request, the close of a connection. Agents often don't. A continuous loop holds its allocations across dozens of tool calls, so VRAM pressure builds gradually rather than spiking and clearing the way a normal request cycle would.
Container-level CPU and RAM limits help with a different but related problem. Memory limits at the container level are non-negotiable, an OOM-killed container is simply a failed inference, and CPU limits stop one agent from monopolizing host cores. But neither of those mechanisms touches GPU VRAM exhaustion. That requires a GPU-level mechanism, full stop, because the cgroup boundary and the CUDA memory boundary are entirely separate systems Opal: Private Memory for Personal AI The GPU Guide to Running Private AI Agents Locally in 2026 Gartner Beyond Static Sandboxing: Learned Capability Governance for Autonomous AI Agents.
Resource exhaustion isn't the only failure mode sharing this isolation layer, either. PromptArmor disclosed a vulnerability in Snowflake's Cortex Code CLI in March 2026, patched in version 1.0.25 released February 28, 2026, where indirect prompt injection combined with weak command validation let AI-generated instructions bypass human-in-the-loop approval, escape the sandbox, and reach cached credentials through arbitrary code execution. The lesson there runs parallel to the OOM story: a sandbox that isn't properly isolated fails in more than one way, and both the memory-exhaustion failure and the security-escape failure trace back to the same underlying isolation boundary.
Detection strategies: knowing an OOM is coming before it arrives
VRAM usage doesn't announce itself. Processes have to actively query their own allocation state, and tools like nvidia-smi, NVML, and DCGM provide the per-process and per-MIG-instance metrics needed to do that. What should get watched? Per-session KV cache block count and its growth rate top the list, a count that climbs linearly turn after turn is the earliest and cleanest warning sign available.
One might argue the cleanest detection point is synchronous rather than reactive. HAMi's pre-allocation OOM check does exactly that, logging CUDA_ERROR_OUT_OF_MEMORY returns right at the allocation call site instead of waiting for a crash to reveal the problem after the fact. That distinction matters operationally: catching the error at the call site gives a chance to react, catching it at crash time means the damage is already done.
MIG changes the monitoring picture in a genuinely useful way. Each instance reports its own VRAM independently, so the isolation boundary and the measurement boundary line up cleanly. Without MIG, attribution gets noisier, since per-process VRAM accounting has to be pieced together rather than read off a clean partition spheron.network. A blind spot teams run into constantly is that standard cgroup-based container memory alerts don't cover GPU VRAM at all, so teams often have CPU OOM visibility but GPU OOM blind spots, because these are separate instrumentation paths. Latency offers a useful secondary signal here too. Rising per-token latency often precedes an OOM in KV cache scenarios, since swapping to CPU RAM adds real latency per eviction, making a latency dashboard a reasonable early warning even before the block-count metrics turn alarming. A rising CPU swap eviction rate in vLLM is a leading indicator that GPU KV cache is already full.
Recovery patterns when OOM does occur in a running agent session
When the OOM-killer fires, it's a hard crash by definition, and context is lost, the tool-call chain breaks mid-execution, and the user's task fails outright. The entire point of a recovery strategy is to reach some checkpoint before that kill signal lands, not to handle the aftermath gracefully, because there often isn't much grace available after the fact.
Checkpoint-based recovery is the most direct answer. Snapshot the agent's workspace, its intermediate outputs, and its accumulated context before VRAM headroom drops below a defined threshold.
Context pruning offers a second, live mitigation path: evict or compress earlier turns in the KV cache as headroom drops, trading some context accuracy for survival. This is exactly the territory MemDecay and CommitKV are working in, lifecycle-aware eviction approaches that aren't production-standard yet but point clearly toward where the field is heading. DROP This defers the failure and adds latency per eviction; it does not restore VRAM headroom.
None of these mitigations matter much unless a hard boundary enforces them, since without that boundary one runaway session can eat the headroom that other sessions need to recover. Setting a session-level VRAM budget, enforced at the infrastructure layer through a MIG profile size or a HAMi limit, keeps one runaway session from eating the headroom that other sessions need to recover. And every recovery event should get logged: which turn triggered it, which tool call was in flight, what the VRAM state looked like at the moment. That data is what turns a team's sizing decisions into something informed by evidence rather than repeated reactive firefighting. Spheron's research, as noted by spheron.network and State of AI Agent Memory 2026, shows that stateful sandboxes that can resume from a snapshot avoid the 200–500ms re-initialization cost of a full sandbox restart.
Allocation strategies that reduce OOM probability before an incident occurs
Short classification or routing calls don't need much: a 5 to 10GB MIG slice is sufficient and leaves capacity for concurrent sessions. Long-context synthesis or code generation calls are a different animal entirely, needing a larger slice or a dedicated GPU outright, since a 10GB MIG profile simply has no path to hosting a 42GB KV cache session spheron.network.
The deeper insight here is that sizing determines which isolation profile is even possible: a 10GB MIG slice cannot host a 42GB KV cache session, and getting the math wrong upstream defeats the isolation choices downstream spheron.network. It's about recognizing that agent calls aren't uniform, and treating them as uniform at dispatch time is where a lot of the sizing math from earlier in this piece quietly breaks down. Mapping workload types to the right profile before dispatch, rather than routing every call through the same allocation, is what keeps the isolation and detection work described in the sections above from having to compensate for a sizing decision that was wrong from the start.